
Automatic Stock Chart Pattern Recognition
Spot head & shoulders, cup and handle, double tops, breakouts, support and resistance, and 20+ classic stock chart patterns — plus daily 200-day moving average deviation rankings. AI-enhanced, automated, and always at your fingertips.
Classic Chart Patterns
Head & shoulders, triangles, flags & more
Technical Indicators
MACD divergence, ADX, super trend & RSI
200-Day MA Deviation
Daily mean-reversion rankings, both directions
Wide Market Coverage
S&P 500, Nasdaq 100 & major US ETFs
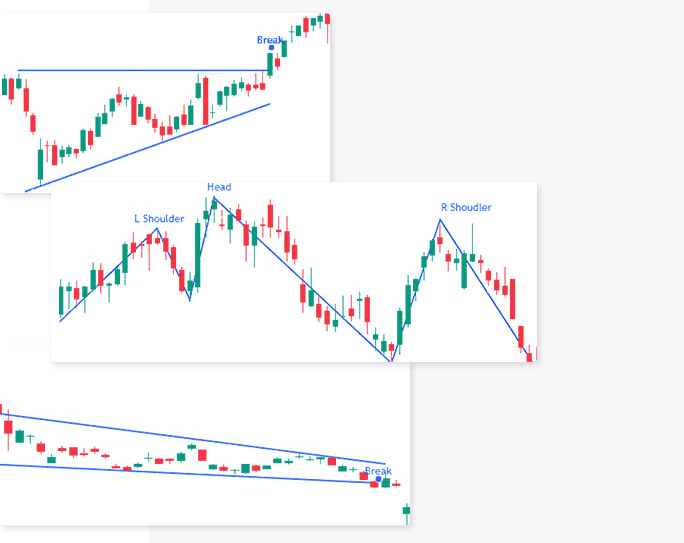
CHART PATTERNS: THE MARKET'S LANGUAGE
Uncover the hidden signals within the market using our chart pattern recognition tool. Classic chart patterns and indicators have been used by traders for generations. these patterns can provide a framework for understanding market psychology and making data-driven trading decisions.
ALGORITHMS AT WORK: UNVEIL TIMELESS & INNOVATIVE PATTERNS
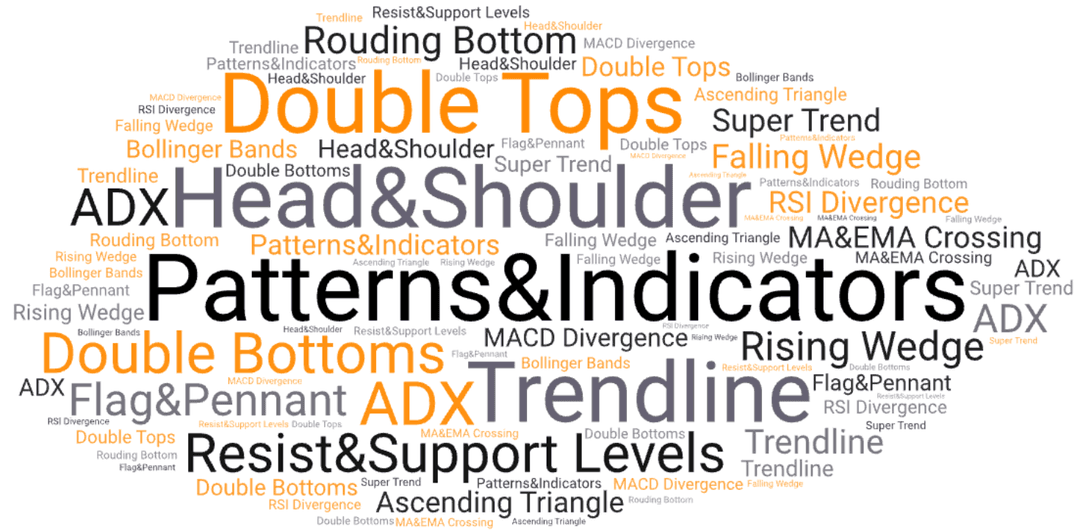
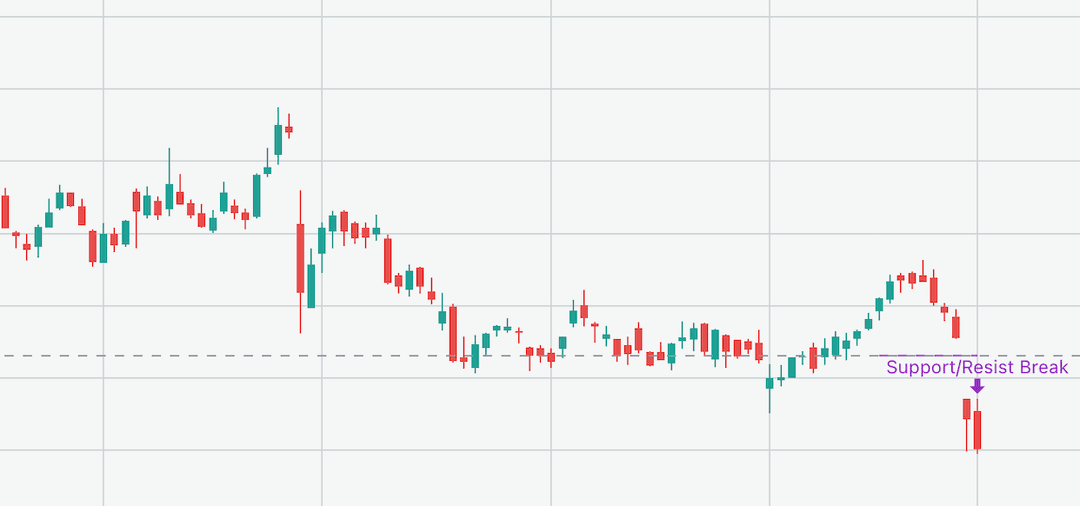
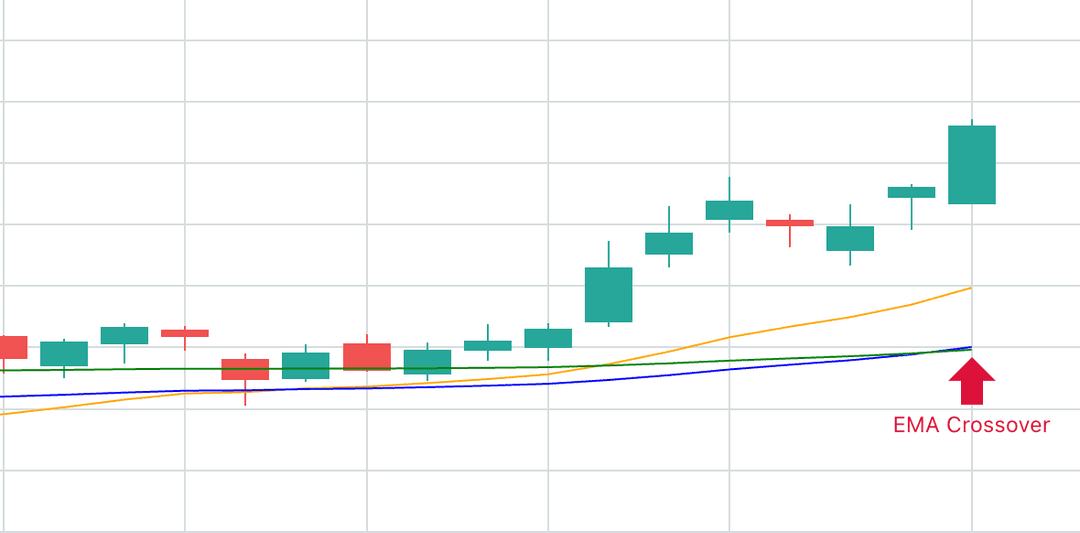
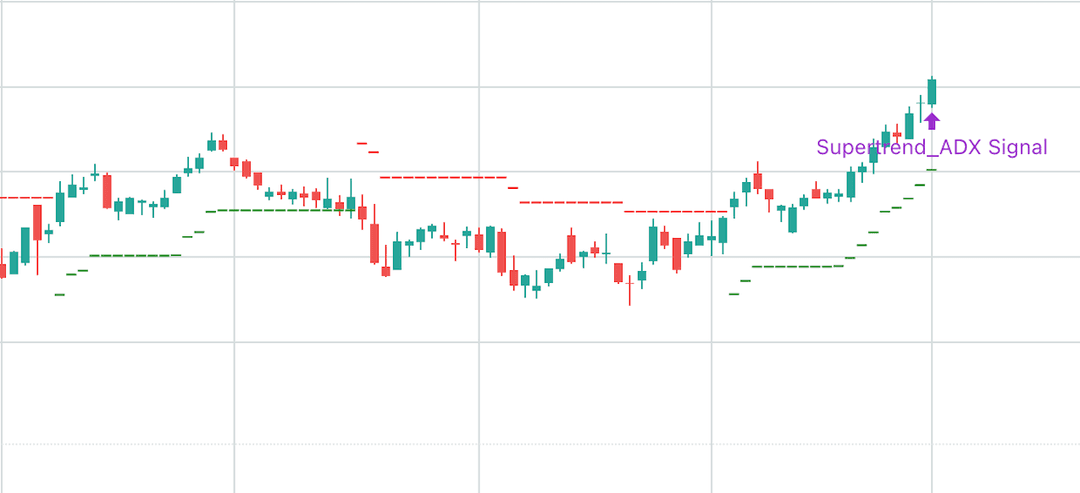
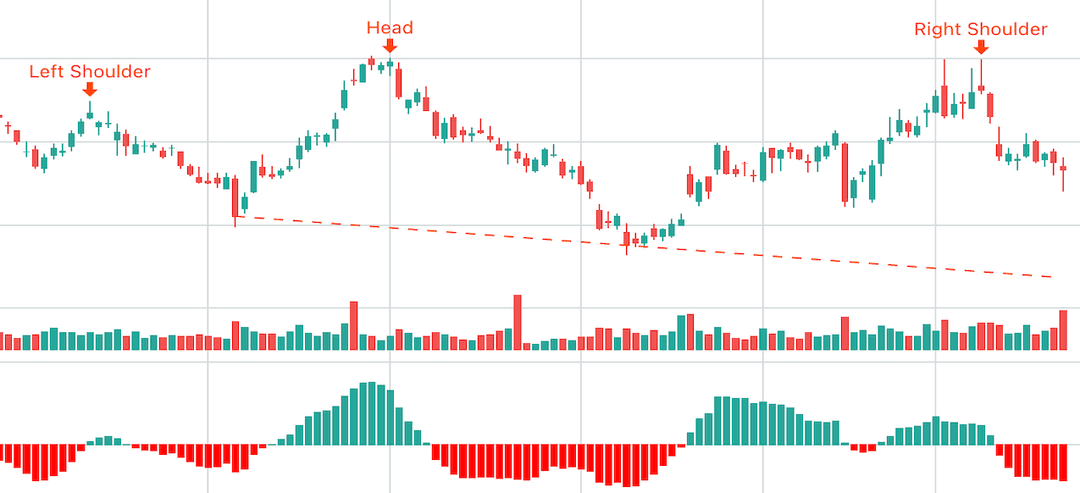
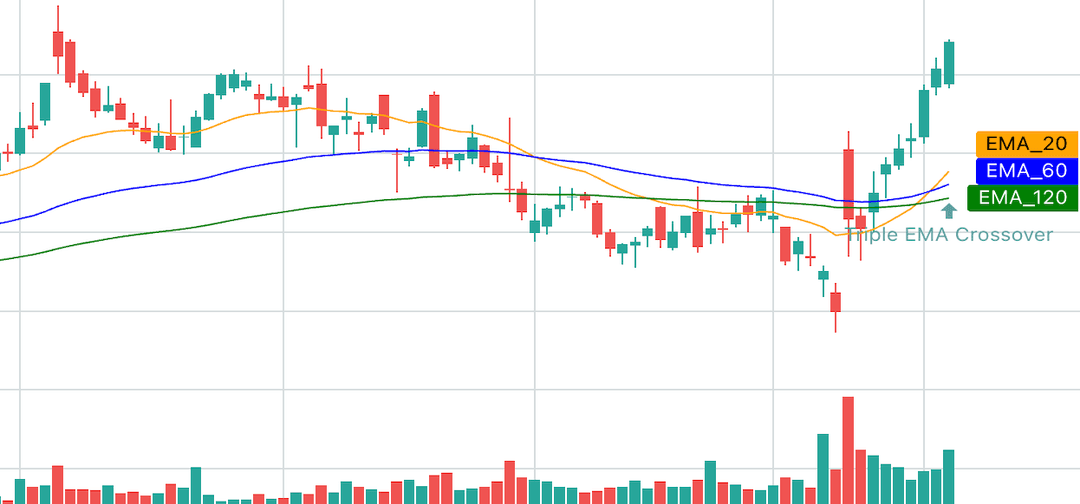
Experience the power of our AI-driven system. Our algorithms accurately detect a vast array of chart formations and technical indicators. It covers proven setups like support/resistance, head & shoulders, and flags, alongside advanced signals such as super trend, MACD divergence, and ADX—empowering your trading strategy.
*This platform is intended for educational and informational purposes only. It does not provide investment advice, trading signals, or recommendations.
DISCOVER THE LATEST STOCK CHART PATTERNS & CAPTURE PRICE TRENDS
Imagine, after each trading day, you analyze the latest stock chart patterns that emerged, pinpointing stocks with impending price trend shifts. This daily review empowers you to make informed trading decisions, ensuring you're well-prepared for a successful and high-quality trading session on the following day. Elevate your market strategy and boost profitability.
UNLEASH THE POWER OF AUTOMATION: DISCOVER CHART PATTERNS FASTER
Say goodbye to manual chart analysis! Our AI-powered automated system tirelessly scans the market, identifying classic chart patterns. By automating this process, you can spend less time searching for opportunities and more time executing your trades.
*This platform is intended for educational and informational purposes only. It does not provide investment advice, trading signals, or recommendations.
TRACK THE STOCKS FURTHEST FROM THEIR 200-DAY MOVING AVERAGE
Beyond chart patterns, our new Deviation Watch ranks the S&P 500, Nasdaq 100, and major US ETFs every trading day by how far the current stock price has strayed from its 200-day moving average. Long-term prices oscillate around the MA200 like gravity — when a price runs far above or sinks far below the trendline, you have a mean-reversion candidate worth a closer look.
Overextended
Stocks trading well above their 200-day average — overbought names that have outrun the long-term trend. Historically these long-side trend signals tend to fade over the following 20–60 days.
Depressed
Stocks trading well below their 200-day average — oversold, beaten-down names where our 2025 backtest found the short-side mean-reversion alpha tends to concentrate.
SUBSCRIBE TO PREMIUM, UNLOCK THE ALGORITHM'S FULL CAPABILITIES
For the price of a streaming subscription, unlock powerful automated chart pattern recognition. Spot more opportunities, save time, and trade smarter.
-
Daily and weekly top chart patterns
-
Covering Nasdaq 100 and S&P 500
-
Data updated every trading day
-
Multi-indicator cross-verification of patterns
-
200-day moving average deviation rankings
-
Trading strategy breakdown for specific chart patterns
-
7 Days Free Trial